DART
 Dispersion relation solver
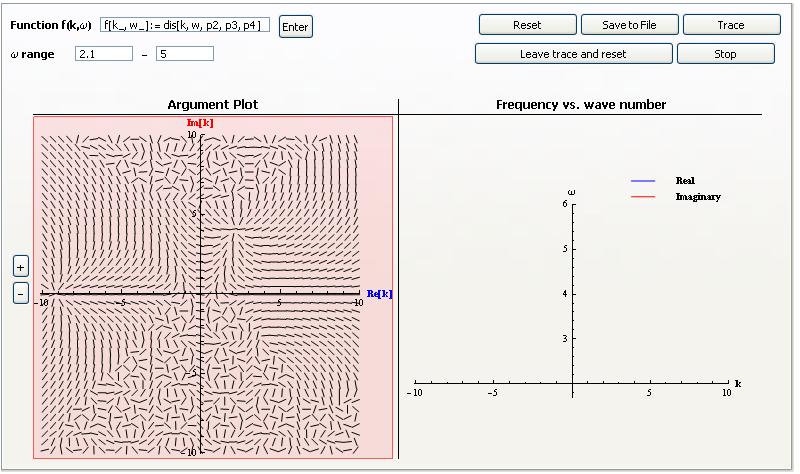
This Mathematica application is a tool for solving wave dispersion relations. The underlying principle of operation is based on the Discrete Argument Theorem outlined by Prof. Edgar Choueiri for finding roots of a function in the complex plane. A user inputs a dispersion function of the form, \( f[k,\omega]=0 \), where \( k \) is the wavenumber and \( \omega \) is the frequency. The user also specifies an initial value of angular frequency, \( \omega_\textrm{min} \), and a final value, \( \omega_\textrm{max} \). At \( \omega_\textrm{min} \), the program displays an ‘argument plot’ (Figure 1) with respect to \( k \) of this function over a part of the complex plane. At each point in the grid, a line is drawn that makes an angle with the real axis equal to the argument of the function at the corresponding value of \( k \) and \( \omega_\textrm{min} \). As any contour generated by \( f[k,\omega_\textrm{min}] \) will circle the roots of the function, the ‘argument vector’ plot will form small ‘vortices’ circling roots in the complex plane. The complexity of these vortices increases with the degeneracy of the root as well as the total number of roots present in the plane. The location of the vortices gives the user a first indication of where the roots of \( f \) are located in the plane.
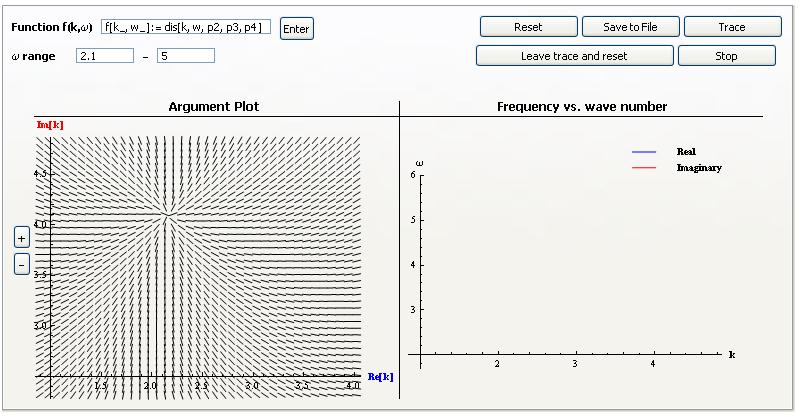
The next step as shown in Figures 2 and 3 is for the user to click on the vortex plot and zoom in on the desired root (typically the most unstable). Once this root is isolated, the user can trace the migration of this root.

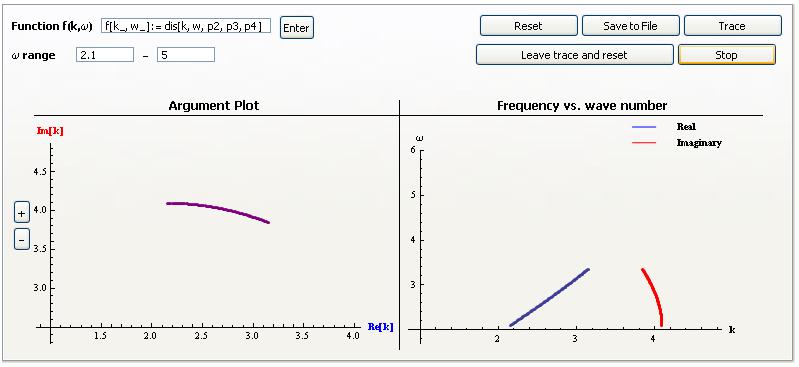
The tracer calls the DART algorithm which overlays a 6 by 6 grid on top of the selected area in the complex plane. It then evaluates two integrals (discussed in Choueiri’s write up) along the contour of each cell in the grid. Using this information, the program flags each cell as either containing a root, not containing root, or suspected of containing a root. It then can find the values of these roots or in the case of a suspect cell, redraw a grid over the cell for greater resolution and repeat the process. Once all the roots have been located in the selected area, the program will incrementally increase the frequency, \( \omega \). In order to save time, however, it will not implement DART again to find roots. Rather, a second algorithm is called that uses Lagrangian interpolation to infer where the next root will occur (based on the location of previously found roots). It will then draw a contour around this location and evaluate the integrals along this line. If a root is found, the value is noted and the tracer algorithm continues. If no root is found, the program redisplays an ‘argument plot’ and the user must locate the lost root and zoom in again to continue tracing. While this process happens, the results are concurrently plotted (Figure 4). At any time, the user can stop the program and save the resulting values in a text file.
This program allows the user to solve most dispersion relations found in plasma physics in a matter of a few minutes. Longer time periods are primarily due to the complex functions found in some of these dispersion relations including Bessel functions and the plasma dispersion function.
This work was supported by NSF grant ATM-0411392.
- Tutorial - DART Tutorial